The code that produced this output is listed below. The additions to the basic graph paper are in bold.
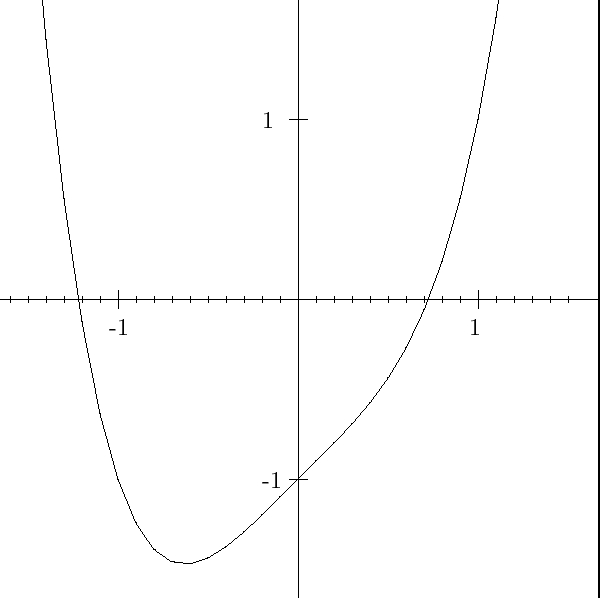
Here is an example of two different tick sizes.
We have graphed $y=x^4+x^2 -1$ close to the origin and are
using the two tick sizes to estimate the roots as $r=.71$ or so
and $r=-1.21$ or so.
The code that produced this output is listed below.
The additions to the basic graph paper are in bold.
%!PS-Adobe-3.0 EPSF-3.0
%%Title: Blank Graph
%%Creator:Laurence R. Taylor  taylor.2@nd.edu www.nd.edu/~taylor
%%Copyright (C) 2000
%%Distribute freely but modifications may remain private
%%CreationDate: ??
%%Version: 1.0.0
%%Data is set near the end of this file. (Search for data.)
%%EXCEPT that you may need to adjust the BoundingBox
%%BoundingBox: -100 -100 100 100

save
%%Initialize variables
/arrx 0 def
/varx 0 def
/ReqFun{}def
/ThetaeqFun{}def
/XeqFun{}def
/YeqFun{}def
/fun_v {}def
/fun_a {}def
/fun_b {}def
/start_v 0 def
/inc_v 0 def
/end_v 0 def
/mX 0 def
/pX 0 def
/mY 0 def
/pY 0 def
/xTick 0 def
/yTick 0 def
/tickSize{3}def
/sxn 0 def

%%TEX fonts
/fontscale{8}def
/vfont{fontscale}def %% vertical distance from bottom of tick to baseline of labels
/hfont{fontscale 2 div}def %% horizontal distance from tick to right edge of labels
/CMR{
/CMR10 findfont fontscale scalefont setfont
}def

/CMMI{
/CMMI10 findfont fontscale scalefont setfont
}def

/poly{
%% Computes a polynomial
%% /YeqFun{ [a_n ... a_1 a_0] poly}def
%% If followed by graph graphs the polynomial
%% y=a_nx^n+ ... +a_1x+a_0
/arrx exch def
/varx exch def
0 0 1 arrx length 1 sub
{arrx exch get exch varx mul add}for
} def

/ADD{
%% USAGE: number {function1}{function2} ADD
%% pops the arguments and pushes function1(number)+function2(number)
/fun_a exch def
/fun_b exch def
dup fun_b exch fun_a add
}def

/MUL{
%% USAGE: number {function1}{function2} MUL
%% pops the arguments and pushes function1(number)*function2(number)
/fun_a exch def
/fun_b exch def
dup fun_b exch fun_a mul
}def

/DIV{
%% USAGE: number {function1}{function2} DIV
%% pops the arguments and pushes function1(number)/function2(number)
%% after checking function2(number) ne 0
/fun_a exch def
/fun_b exch def
dup fun_b exch fun_a
dup 0 eq{pop pop pX mX sub pY mY sub add 100 add}{div}ifelse
}def


/pi{3.1415}bind def
/radians{180 mul pi div}def
%% converts radians to degrees
%% - postscript trig functions take degree arguments

/COS{ radians cos}def %% Radian versions of standard trig functions
/SIN{ radians sin}def
/TAN{ radians {sin}{cos} DIV}def


%% Any plotting function can have a sing_ prepended
%% This plots just as the non-sing version except that
%% each point is checked to see how far it is from the
%% previous point and if it is too far, we just moveto
%% the point rather than lineto it. This prevents lines
%% connecting jump discontinuities of the function.
%% (VERY steep parts may also be skipped.)
%% The sing_ version is slower than the non-sing version
%% and should only be used when the regular version shows
%% lines you don't want.

/PLOT{
/fun_v exch def %% Pops the parameter value and
                %% pushes the xy-coordinates of the point
/end_v exch def
/inc_v exch def
/start_v exch def
start_v fun_v moveto %% moveto start
start_v inc_v end_v {fun_v lineto} for %% connect the dots
}def

/sing_PLOT{
/fun_v exch def
/end_v exch def
/inc_v exch def
/start_v exch def
start_v fun_v /last_y exch def /last_x exch def %% initialize last_?
last_x last_y moveto                            %% and move to there to start
start_v inc_v end_v { %% initialize for-loop
fun_v /next_y exch def /next_x exch def %% get next_?
next_x next_y                           %% arguments for lineto/moveto
0 last_y next_y sub abs pY sub mY add le{moveto}{ %% dy too big? moveto
0 last_x next_x sub abs pX sub mX add le{moveto}{ %% dx too big? moveto
lineto}ifelse}ifelse %% otherwise, lineto
/last_x next_x def/last_y next_y def %% shift next_? to last_?
} for
}def

%% Cartesian coordinate stuff
/XY{
%% Pops a parameter value off the stack and pushes the xy-coordinates
%% of the point in the current parameterized curve
dup XeqFun xTick mul exch YeqFun yTick mul
}def

/graph{
%% Just like Graph but XeqFun and YeqFun are reset to {}
%% This usually means that one can graph
%% y=f(x) by just defining YeqFun OR
%% x=f(y) by just defining XeqFun
%% USAGE:  start_v increment_v end_v graph
Graph /XeqFun{}def /YeqFun{}def
}def

/Graph{
%% Takes the current definitions of XeqFun and YeqFun
%% and graphs the parameterized curve.
%% It is automatically scaled so that x=1 appears at the first
%% xTick and y=1 appears at the first yTick
%% USAGE:  start_v increment_v end_v Graph
%% Will graph y=YeqFun(t) x=XeqFun(t) from start_v to end_v by drawing lines
%% between successive points with t increased by increment_v.
%% Needs to be stroked to see graph so we can use graph
%% to make paths.
%% XeqFun and YeqFun are retained.
{XY} PLOT
}def

/sing_graph{sing_Graph /XeqFun{}def /YeqFun{}def
}def
/sing_Graph{{XY} sing_PLOT}def
%% POLAR COORDINATE STUFF

/polarcoordinates{
%% pops r and theta from the stack and pushes x and y
dup 3 -1 roll dup 4 1 roll exch COS mul xTick mul 3 1 roll SIN mul yTick mul
}def

/RT{
%% Pops a parameter value off the stack and pushes the r\theta-coordinates
%% of the point in the current parameterized polar curve
dup ReqFun exch ThetaeqFun
}def

/XYpolar{
%% Pops a parameter value off the stack and pushes the xy-coordinates
%% of the point in the current parameterized polar curve
RT polarcoordinates
}def

/polar {
%% Takes the current definitions of ReqFun and ThetaeqFun
%% and graphs the parameterized curve in polar coordinates.
%% USAGE:  start_v increment_v end_v polar
%% Just like Polar except /ReqFun and /ThetaeqFun
%% are reset to {}
Polar /ReqFun{}def /ThetaeqFun{}def
}def

/Polar {
%% Takes the current definitions of ReqFun and ThetaeqFun
%% and graphs the parameterized curve in polar coordinates.
%% Need to write functions /ReqFun and /ThetaeqFun
%% USAGE:  start_v increment_v end_v Polar
{XYpolar} PLOT
}def

/sing_polar {
sing_Polar /ReqFun{}def /ThetaeqFun{}def
}def
/sing_Polar {
{XYpolar} sing_PLOT
}def

/axes{
   newpath
   mX 0 moveto
   pX 0 lineto
    stroke
   0 mY moveto
   0 pY lineto
   stroke } def

/Xtick{
%% puts ticks along the x-axis from the origin
%% with displacement xTick until pX to the right and mX to the left
xTick xTick pX
{
0 moveto
0   tickSize rmoveto
0   tickSize -2 mul rlineto
}for
/nT{xTick -1 mul}def
nT nT mX
{
0 moveto
0   tickSize rmoveto
0   tickSize -2 mul rlineto
}for
stroke} def

/Ytick{
%% puts ticks along the y-axis from the origin
%% with displacement yTick until pY up and mY down
yTick yTick pY
{
0 exch moveto
tickSize  0 rmoveto
tickSize -2 mul  0 rlineto
}for
/nT{yTick -1 mul}def
nT nT mY
{
0 exch moveto
tickSize  0 rmoveto
tickSize -2 mul  0 rlineto
}for stroke
} def

/Show{true charpath }def %% use instead of show when writing self-writing labels
/label{ /opx{show}def /myshow{true charpath}def /myfill{}def LaBel}def
/Label{ /opx{exec}def /myshow{exec}def /myfill{fill}def LaBel}def
/LaBel{
%%Sticks an array of labels along axes.
%%Four variants
%%USEAGE: array (+x) label
%%USEAGE: array (-x) label
%%USEAGE: array (+y) label
%%USEAGE: array (-y) label
%%Puts elements of array along positive(+)/negative(-) x/y axis
%%starting at the origin.
%%Elements of array are just strings to be printed in the current font.
%%Use Label if the array elements print themselves. This is useful
%%for example if different elements of your string need to be printed
%%in different fonts.
%%EG: [ {CMMI (\31)show CMR(/2)show} ] prints pi over 2
/sxn exch def
/arrx exch def
0 1 arrx length 1 sub {
dup arrx exch get 0 0 moveto myshow
pathbbox /ur_y exch def/ur_x exch def/ll_y exch def/ll_x exch def
newpath
ur_x ll_x sub /my_x exch def
ur_y ll_y sub /my_y exch def
(+x) sxn eq
{dup xTick mul xTick add 0 moveto
my_x -2 div -1 tickSize mul vfont sub rmoveto
arrx exch get opx}if
(-x) sxn eq
{dup xTick mul xTick add -1 mul 0 moveto
my_x -2 div -1 tickSize mul vfont sub rmoveto
arrx exch get opx}if
(+y) sxn eq
{dup yTick mul yTick add 0 exch moveto
0 hfont sub tickSize sub my_x sub my_y -2 div rmoveto
arrx exch get opx}if
(-y) sxn eq
{dup yTick mul yTick add -1 mul 0 exch moveto
0 hfont sub tickSize sub my_x sub my_y -2 div rmoveto
arrx exch get opx}if
myfill}for}def

%%%%%%%  data %%%%%%%%%
%%BoundingBox: -100 -100 100 100
%%BoundingBox: left-x lower-y right-x upper-y
%% COPY "BoundingBox" LINE TO TOP OF FILE
%%%%%%%  Axes - generic values, reset as needed
/tickSize{3}def
/pX{100}def       %% Positive x-axis length
/pY{100}def       %% Positive y-axis length
/mX{-100}def      %% Negative x-axis length
/mY{-100}def      %% Negative y-axis length
/xTick{60} def    %% tick length for x-axis
/yTick{60} def    %% tick length for y-axis

/Narr{ [(-1) (-2) (-3) (-4) ]} def  %% the negative labels
/Parr{ [(1) (2) (3) (4)]} def       %% the positive labels

%%Page: 1 1
CMR  %% Sets basic TEX font
.4 setlinewidth


axes
.1 setlinewidth

Xtick
Ytick

save
/xTick{6}def /tickSize{1}def
Xtick
restore


Parr (+x) label
Parr (+y) label
Narr (-x) label
Narr (-y) label

/YeqFun{ [ 1 0 0 1 -1] poly }def
-2 .1 2 graph stroke


showpage
restore